
Тип бассейна:
Подтип бассейна:
Класс бассейна:
Возраст бассейна:
Тип полезных ископаемых:
Геологический возраст начало:
Геологический возраст конец:
Площадь: 376905.9 км²
Bahamas
The Great Bahama Bank (GBB) is a flat‐topped shallow‐ marine carbonate platform that has served as a major modern example for understanding the processes of both modern and ancient carbonate sedimentation (Schlager & Ginsburg, 1981). Its sedimentation patterns have formed the basis for many geological models and reservoir analogues. From such patterns, Fischer (1964) inferred the importance of climate variations from Milankovitch frequency in the cyclicity of Triassic shallow‐marine carbonate deposits. To assess the accommodation space created by subsequent sea‐level rises, Fischer constructed plots in which the cycle thickness is plotted against cycle number (proxy for time) and corrected for subsidence. Cycle thickness in excess of the subsidence is then taken as the amount of accommodation space created by sea‐level rise (Fischer, 1964; Goldhammer, Dunn, & Hardie, 1987, 1990; Osleger & Read, 1991; Sadler, Osleger, & Montañez, 1993). The Fischer‐plot method combined with spectral analysis of the cyclicity led to numerous studies (Cozzi, Hinnov, & Hardie, 2005; Goldhammer et al., 1987; Hinnov & Goldhammer, 1991; Husinec, Basch, Rose, & Read, 2008; Read & Goldhammer, 1988) that discuss the presence of orbitally controlled sea‐level oscillations with Milankovitch frequencies within Triassic shallow‐water carbonate platforms. Inference that variation in cycle thickness records variation in the amplitude of sea‐level rise was based on the principal assumption that each carbonate cycle represents the complete infill of accommodation space during sea‐level rise and is marked by a shallowing‐upward facies succession that terminates in an exposure surface. Other studies have disputed the notion that full‐length Milankovitch frequencies are recorded in the platform cycles of Triassic carbonate platforms and have provided very strong evidence for the presence of sub‐Milankovitch cyclicities (Brack, Mundil, Oberli, Meier, & Rieber, 1996; Mundil et al., 2003; Reijmer, Sprenger, Ten Kate, Schlager, & Krystyn, 1994; Schwarzacher, 1993; Schwarzacher & Haas, 1986; Zühlke, Bechstädt, & Mundil, 2003). All of these studies provided the foundation for cyclostratigraphic studies in shallow‐marine carbonates, which assessed simultaneously Milankovitch cyclicity and the amplitude of sea‐level changes (Kerans & Tinker, 1997). Other authors, however, argued strongly that processes of peritidal carbonate accumulation are stochastic, indicating that that the thickness frequencies of these deposits did not carry a signature of rhythmic eustatic forcing (Drummond & Wilkinson, 1993; Wilkinson, Drummond, Rothman, & Diedrich, 1997).
Several studies (Bergman, Westphal, Janson, Poiriez, & Eberli, 2010; Boss & Rasmussen, 1995; Eberli, 2013) pointed out that uncertainties do occur when assuming that stacked cycle thicknesses and facies variations correlate with the cyclic changes in water depth. Studies of the GBB as a modern example show that the Holocene sediment infill of the available accommodation space is a recent feature west of Andros Island (Maloof & Grotzinger, 2012) and the major part of the platform has remained unfilled (Bergman et al., 2010; Boss & Rasmussen, 1995). For ancient carbonate platforms, similar observations were made suggesting that infill of accommodation space was a more random process, e.g., the Maiella platform margin (Central Italy; Eberli, 2013), the Latemar limestone platform (northern Italy; Kemp, Manen, Pollitt, & Burgess, 2016), and the Cambrian and Ordovician peritidal sequences exposed throughout the south‐central Appalachians (Wilkinson, Diedrich, & Drummond, 1996). In these studies, unpredictable variations were found as variable or incomplete cycle thickness, variable cycle frequency, and absence of a shallowing‐upward trend within the cycle (Eberli, 2013; Kemp et al., 2016; Wilkinson et al., 1996). Other uncertainties relate to the partial erosion of sediment infilling accommodation space during sea‐level fall as well as facies‐dependent variations in sediment compaction (Strasser, Pittet, Hillgärtner, & Pasquier, 1999). Hence, evaluating relationships between the rates of carbonate deposition, facies distribution, and ambient accommodation space remains challenging. This study aims to examine the relationships between accommodation space, sediment thickness, and facies distribution on a modern platform where sea‐level history, water depth, and sediment types are well constrained.
The variations in thickness of the Holocene sediments on the western GBB and Little Bahama Bank have been measured at several locations (Beach & Ginsburg, 1980; Boss, 1994; Cruz, 2008; Harris, 1979; Rankey & Doolittle, 1992), but not yet in the western area of GBB. In the present study, the variations in sediment thicknesses for the Holocene and upper Pleistocene are mapped and modelled using a high‐resolution 2D‐seismic survey covering the length and width of the western portion of GBB. These variations were related to the in situ water‐depth measurements and facies analysis of Reijmer et al. (2009). To test the assumption whether sediment thickness is related to variations in sea‐level, two questions need to be answered: (i) does a correlation exist between the Holocene cycle thickness and the present‐day water depth, and if not, (ii) what are the dominant factors controlling sediment thickness on GBB? Data discussed in this study demonstrate the lack of correlation between the Holocene sediment thickness, facies type, and accommodation space (i.e., water depth). They strongly suggest that the hydrodynamic energy level within the lagoon determines the infill of accommodation space and the facies distribution pattern. The results document that using cycle thickness and facies change of shallow‐marine carbonates as a measure for the amplitude of relative sea‐level change should be treated with great care.
GEOLOGICAL AND DEPOSITIONAL SETTING
Great Bahama Bank, the largest carbonate platform within the Bahamian archipelago, is located on the south‐eastern continental margin of the North‐American plate (Cloud, 1962; Purdy, 1963a; Smith, 1940) (Figure 1). The Pleistocene and Holocene evolution of GBB relates to repeated platform growth during sea‐level highstands (Aurell, McNeill, Guyomard, & Kindler, 1995; Beach & Ginsburg, 1980; Kievman, 1998; Manfrino & Ginsburg, 2001) combined with typical highstand shedding of platform sediments into the surrounding basins (Betzler, Reijmer, Bernet, Eberli, & Anselmetti, 1999; Droxler & Schlager, 1985; Reijmer, Schlager, Bosscher, Beets, & McNeill, 1992; Reijmer, Schlager, & Droxler, 1988; Schlager, Reijmer, & Droxler, 1994). During sea‐level lowstands, karst horizons developed on the platform surface due to subaerial exposure (Kievman, 1998; Manfrino & Ginsburg, 2001; McNeill, Grammer, & Williams, 1998). These horizons can easily be traced in seismic sections due to their strong reflections (Cruz, 2008).
FIGURE 1 Bathymetric map of the study area and surrounding waters showing the shallow‐marine carbonate platform Great Bahama Bank, and the deep‐water re‐entrants NW Providence Channel, separating Great‐ from Little Bahama bank and Tongue of the Ocean. White lines indicate seismic survey with a X‐STAR Full SpectrumTM Digital Sub‐Bottom Profiler transmitting a FM pulse with 20 ms of length and a linear sweep of 2–10 kHz bandwidth during the GBB Geolithochem expedition in September 2007: 13 seismic surveys (yellow numbers) consisting of 201 SEGY‐lines with 326 in situ water‐depth measurements; measured every 1.67 km. Map modified after Reijmer et al. (2009)
Extensive research has been carried out to determine the modern facies distribution on GBB (Harris, Purkis, Ellis, Swart, & Reijmer, 2015; Purdy, 1963a, 1963b; Reijmer et al., 2009; Traverse & Ginsburg, 1966). The maps in Figure 2 show that nonskeletal, mud‐dominated sediments mark the inner platform, whereas skeletal, coarse‐grained sediments dominate at the platform edge (Enos, 1974; Purdy, 1963a, 1963b; Reijmer et al., 2009). Very fine‐ grained sediments occur in protected areas, such as the lee side of Andros (Maloof & Grotzinger, 2012). In agreement with earlier studies, Reijmer et al. (2009) and Harris et al. (2015) suggested that the sediment distribution of GBB is a result of a combination of factors that control the energy distribution across the platform and thus the type of sedimentation, tidal velocities, the dominant wind directions, wave energy, and the interaction with the inherited Pleistocene topography.
Acquisition
The data set consists of 13 high‐resolution shallow seismic lines with a total length of approximately 560 km that are either north–south or east–west orientated (Figure 1). The seismic survey was carried out with a X‐STAR Full SpectrumTM Digital Sub‐Bottom Profiler transmitting a FM pulse with a length of 20 ms and a linear sweep of 2 to 10 kHz bandwidth during the GBB Geolithochem expedition in September 2007. In addition to the seismic survey, water depth measurements were carried out every 1.67 km at 326 points on the seismic lines (Figure 2).
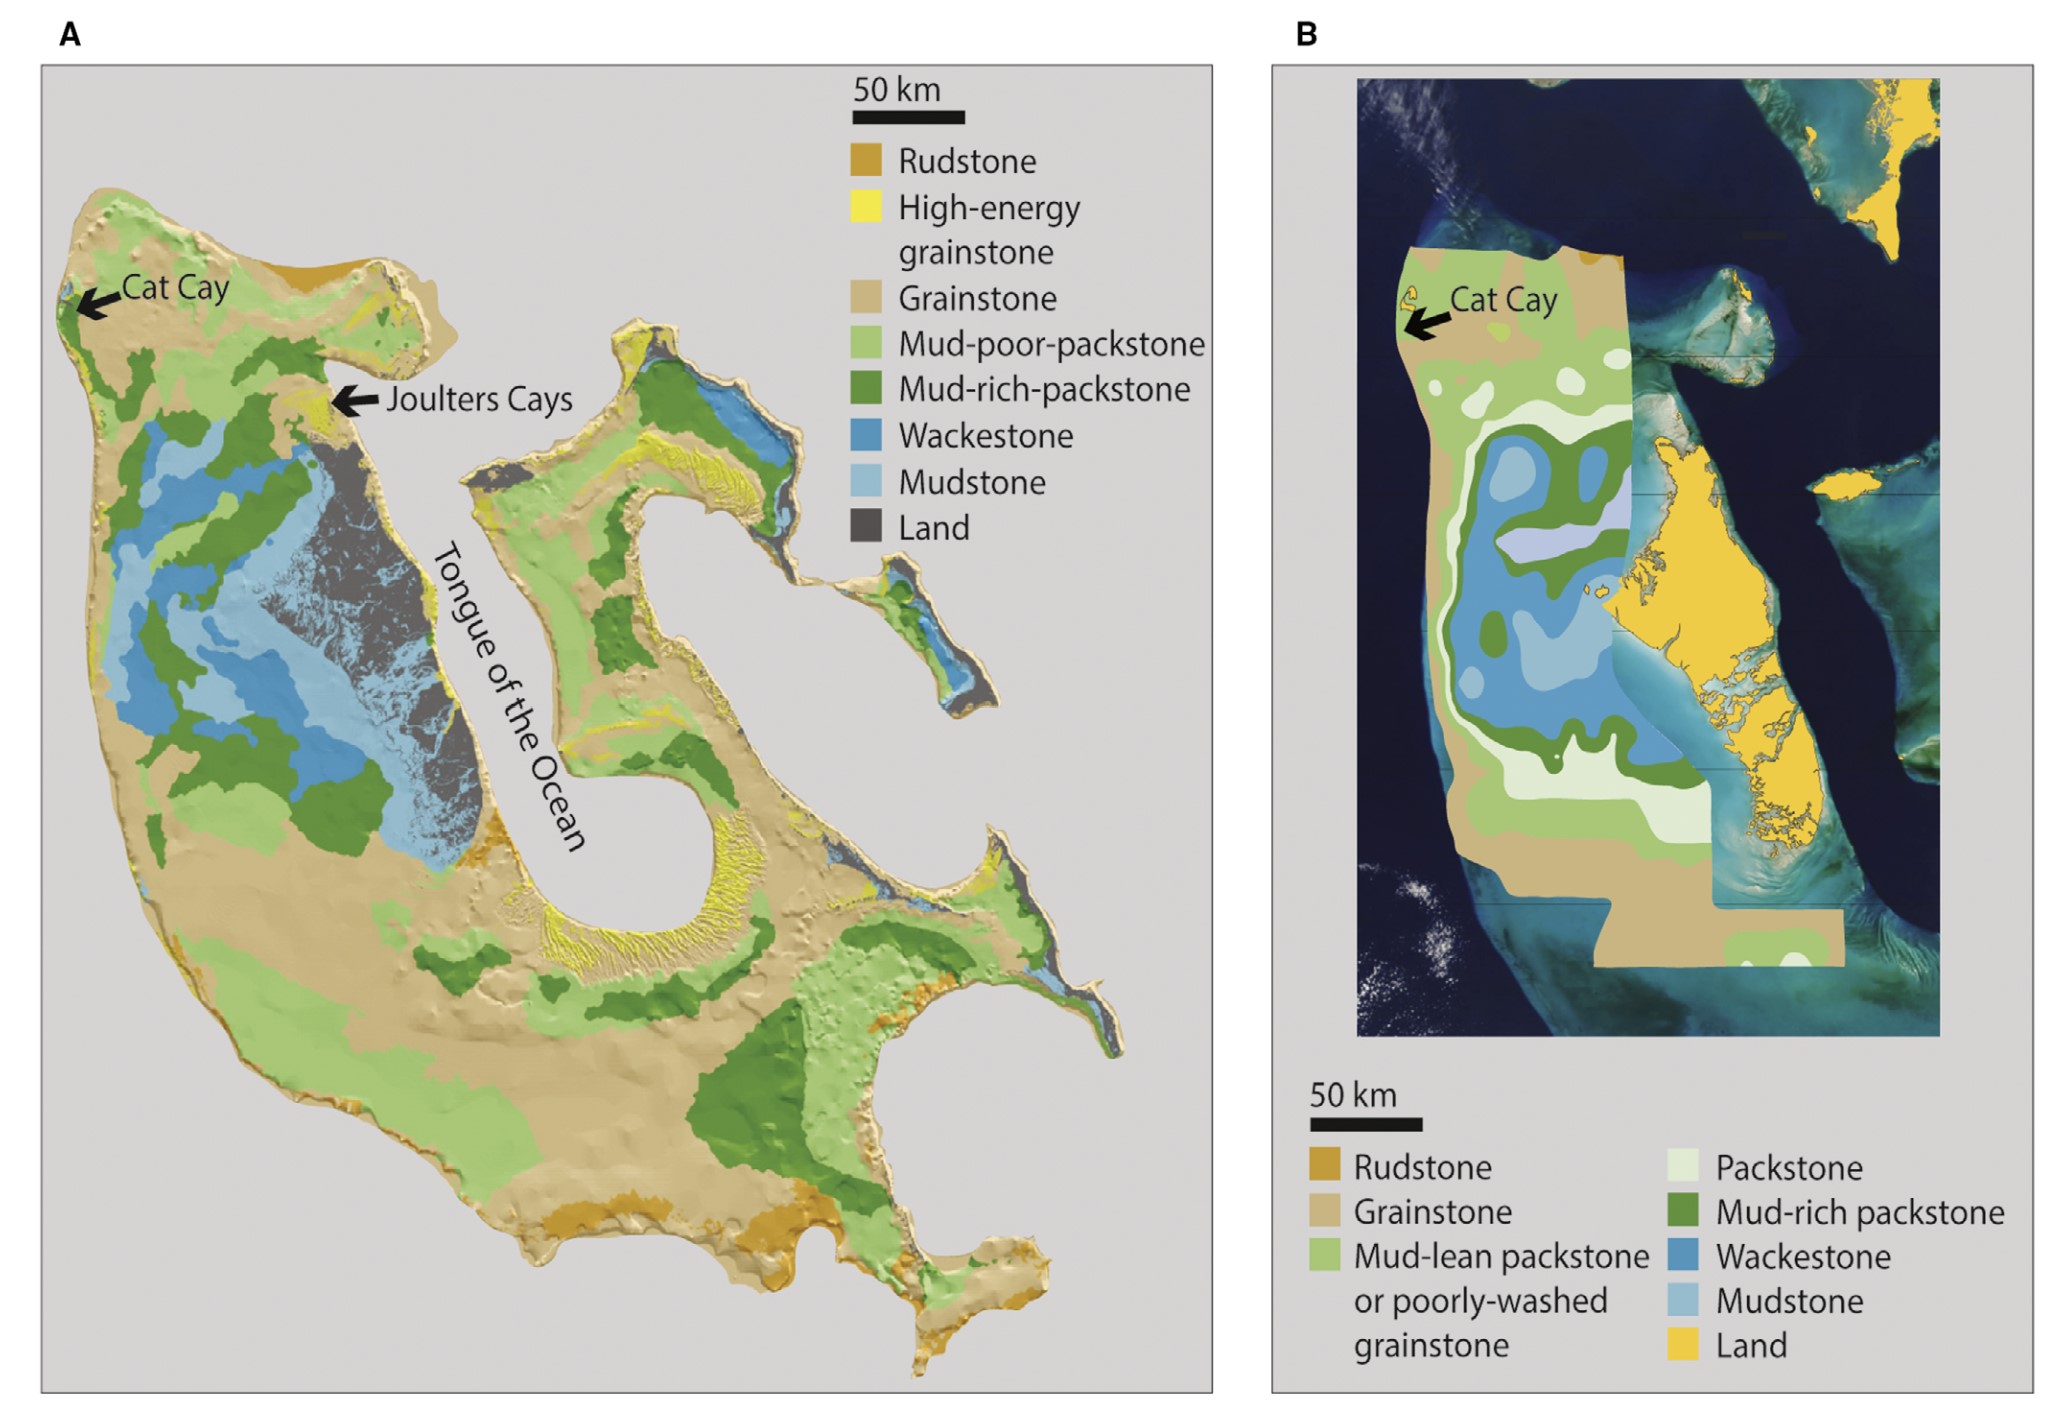
FIGURE 2 Facies maps of GBB. (A) From Harris et al (2015) based on Landsat mosaic satellite imagery and samples collected by Reijmer et al (2009); (B) Facies interpretation from Reijmer et al (2009) based on the collection of samples from 291 surface sediment samples
Seismic analysis
Two important seismic horizons have been recognized in earlier studies (Cruz, 2008) in CHIRP data from the shallow GBB subsurface: the seabed and the Pleistocene top (karst). As it is assumed that the Holocene layer on GBB consists of a single carbonate cycle starting from the onset of an interglacial period with sea‐level rise after the last Pleistocene glacial period (Harris et al., 2015), the difference in depth between the seabed and top‐Pleistocene surface represents the thickness of the Holocene sediments (Figure 3). A third horizon (Figure 3) can locally be recognized to occur below the top of the Pleistocene and is interpreted as a karst horizon during a period of exposure within the Pleistocene (Cruz, 2008).
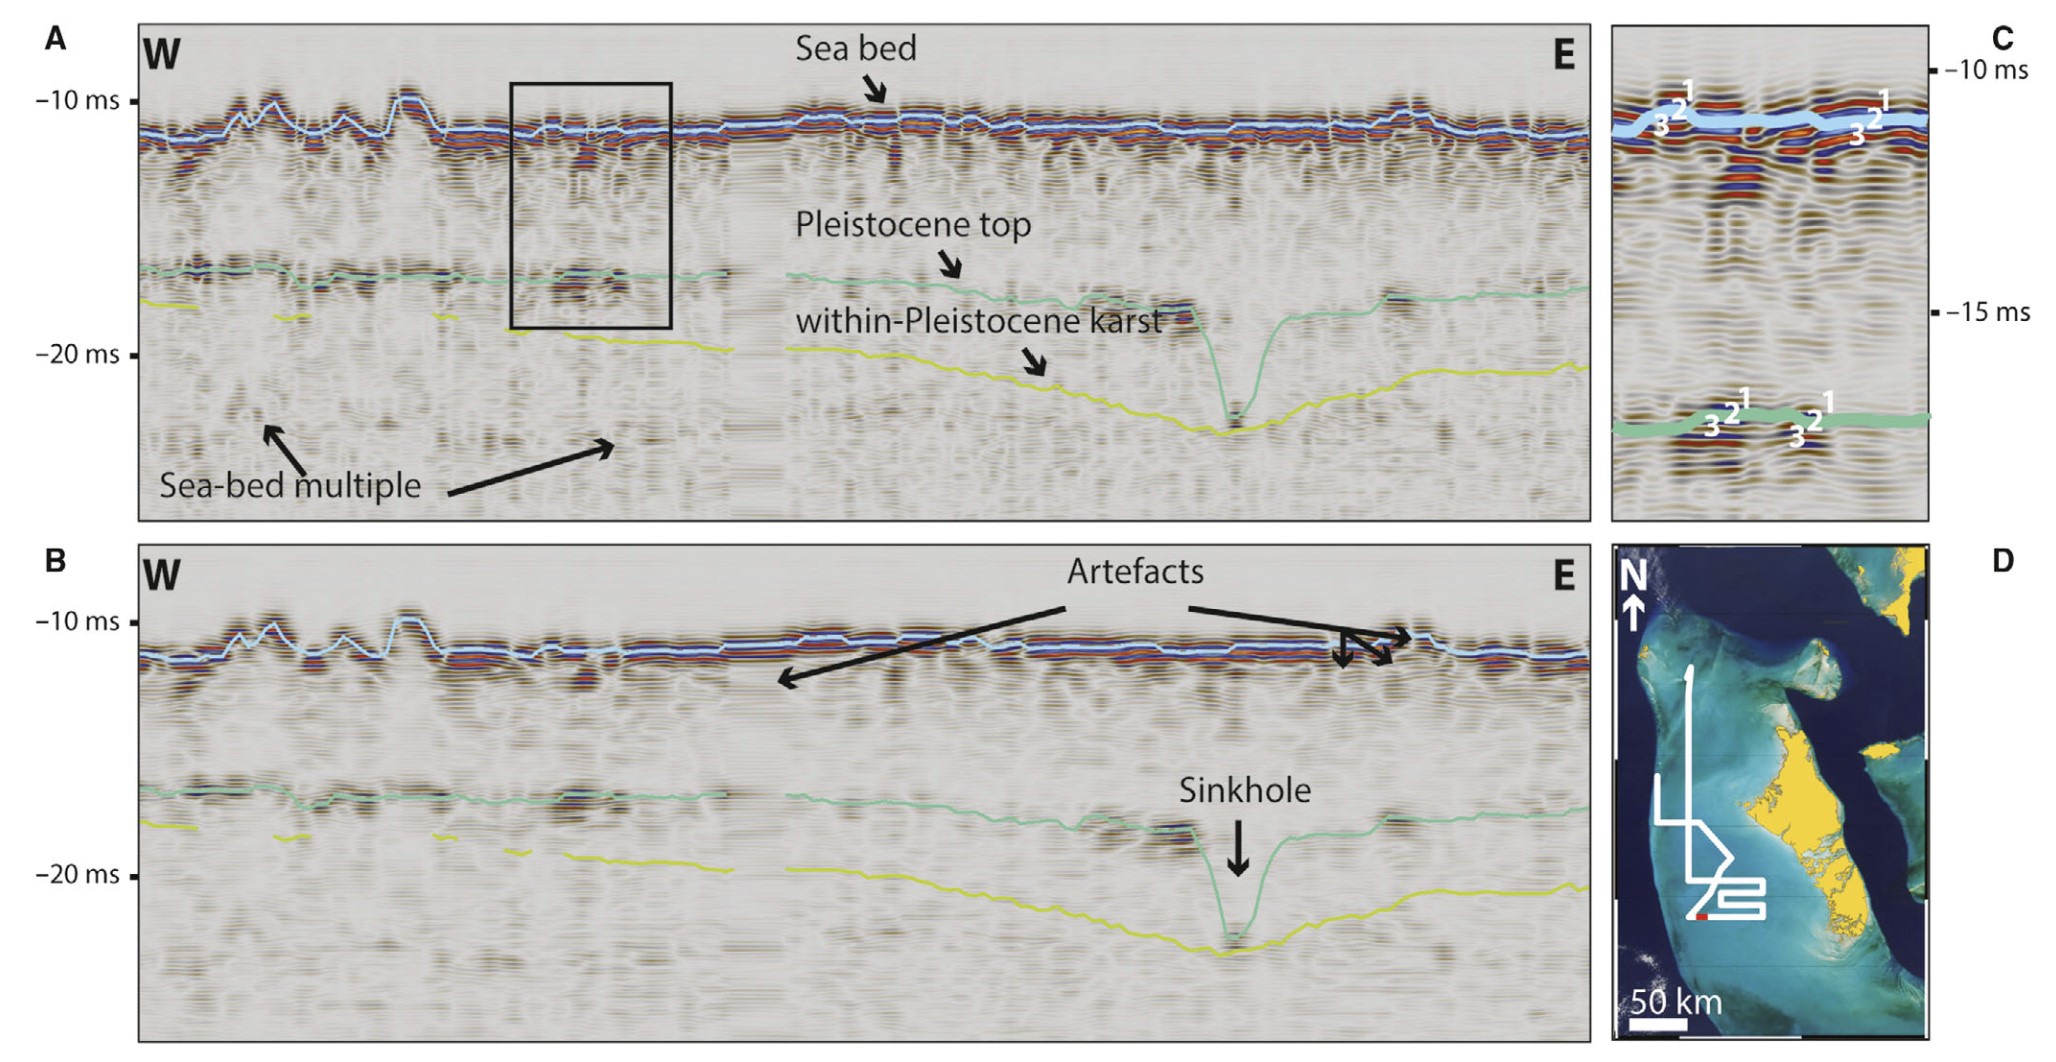
FIGURE 3 Composite line 9 2D‐converted. (A) Seismic section showing the horizons of interest: the seabed, the Pleistocene top, and the within‐Pleistocene karst horizon. Multiples from the seabed are locally present. (B) Seismic section with the volume attribute “Structural Smoothing” to provide increased layer continuity and signal/noise ratio without sacrificing the vertical resolution. Processing artefacts are indicated as well as a sinkhole in the Pleistocene top. (C) Portion of (A) showing how the horizons were picked. (D) Location of this seismic section indicated on the map of GBB (red).
The identified horizons were transferred into depth surfaces in Petrel™ using a velocity model in which a P‐wave velocity of 1,543 m/s was used for sea water (calculation in Supplementary Materials). The acoustic velocities for the Holocene and top‐ Pleistocene layer were based on averaged values obtained from petrophysical analyses on the deep drill holes Clino and Unda from the Bahamas Drilling Project (Anselmetti & Eberli, 1993), cores from Long Key and Stock Island in the Florida Keys (Anselmetti, Von Salis, Cunningham, & Eberli, 1997), and Leg 101 and 166 cores from the Ocean Drilling Project (Anselmetti, Eberli, & Ding, 2000; Kenter, Anselmetti, Kramer, Westphal, & Vandamme, 2002). For the Holocene layer, this resulted in a minimum P‐wave velocity of 1,650 m/s for very fine wackestones and a maximum velocity of 1,850 m/s for grainstones (Figure 4). The top‐Pleistocene sediments range from 3,200 m/s to 5,300 m/s (Anselmetti & Eberli, 1993), corresponding to the minimum and maximum P‐wave velocities used in our velocity model for the second layer between the Pleistocene top and the within‐Pleistocene karst horizon. A detailed description of the seismic processing and the thickness model can be found in the Supplementary Materials.
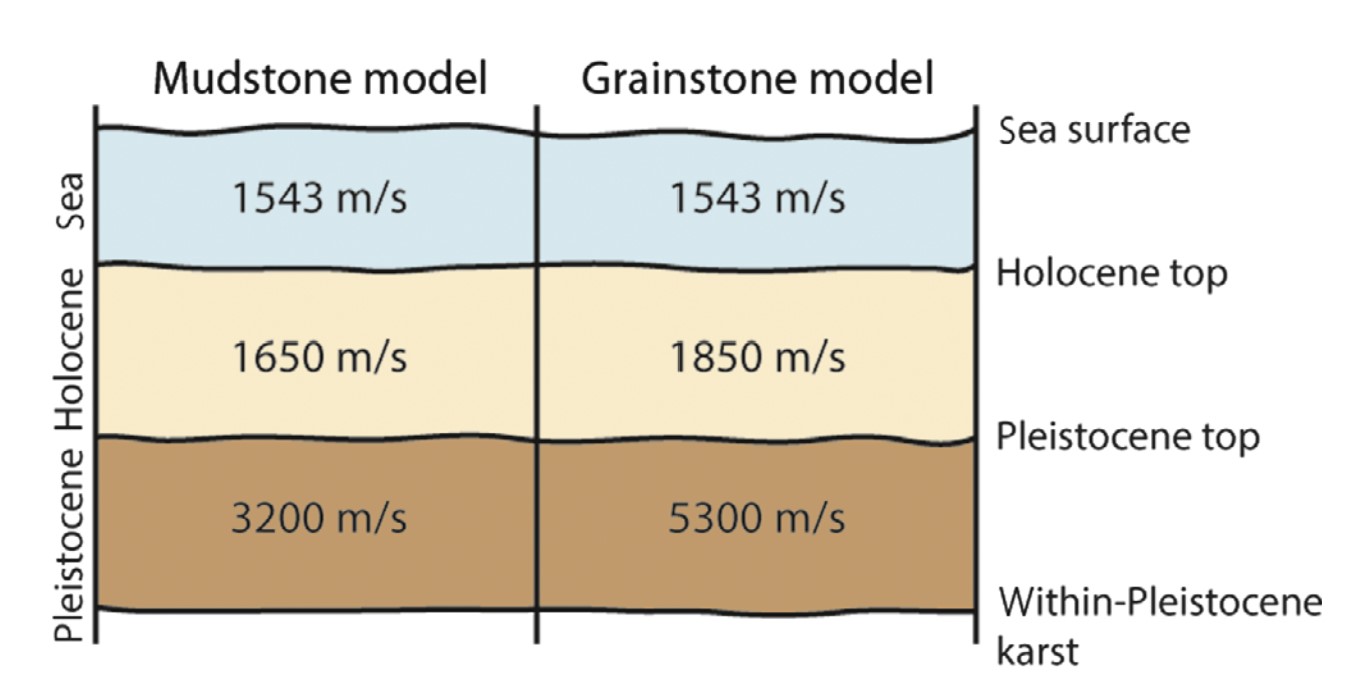
FIGURE 4 Graphic representation of the model input. Left: Vp‐values for the mud‐dominated model. Right: Vp‐values for the mud‐free model
Data source: The limited link between accommodation space, sediment thickness, and inner platform facies distribution (Holocene–Pleistocene, Bahamas). Rieneke Weij, John J. G. Reijmer, Gregor P. Eberli, Peter K. Swart. 2017
Следующий Бассейн: Blake Plateau Ultradeep